
The Participants Dashboard provides detailed, participant-level insights into engagement across your iECHO programs. It enables coordinators and administrators to monitor individual attendance, certification status, professional background, and learning contributions such as case presentations.
This dashboard is particularly useful for:
- Tracking participant engagement and retention across programs.
- Identifying eligible participants for certification based on their attendance.
- Supporting reporting and outreach efforts.
- Evaluating participant learning journeys on an individual level.

| Metric | How It Is Calculated |
|---|---|
| Total Participants | Total number of participants registered in all programs of the organization. |
| Active Participants | Total number of unique participants registered in the organization's active programs during the selected time period or under applied filters. |
| Guest Participants | Participants who join public program sessions via direct email link without registering on iECHO. They are added through the guest participant option given under the session details page. |
| Case Presenters | Total number of participants who have presented approved case presentations in sessions. |
Participants List
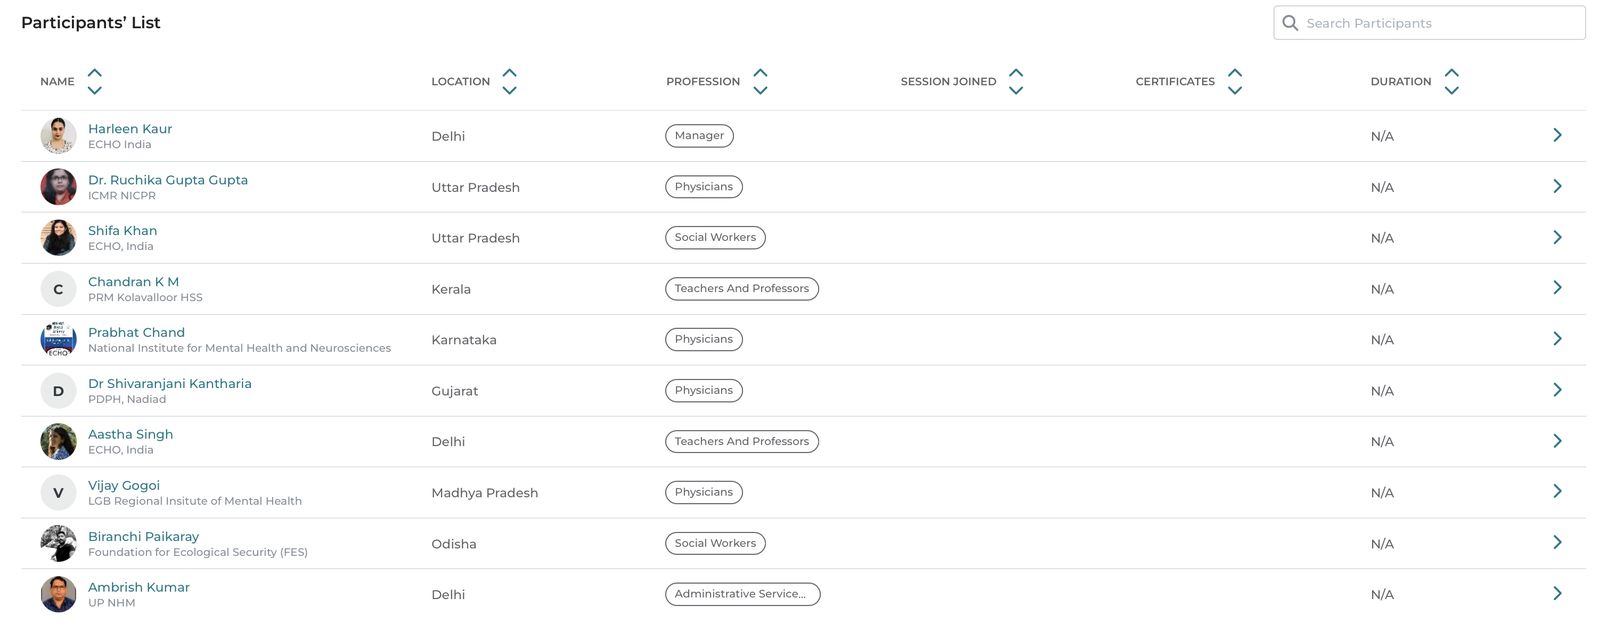
The Participants List is a searchable and sortable table that displays all individuals associated with the selected program, batch, session, and time range. Each row represents a unique participant and provides a snapshot of their engagement.
Key Metrics
| Column | Description |
|---|---|
| Name | Displays the participant's name, profile image, and affiliated organization. |
| Location | Indicates the participant's state or region, helping assess geographical reach. |
| Profession | Shows the participant's professional category (e.g., physicians, teachers and professors, social workers). |
| Sessions Joined | The total number of sessions the participant has attended within the selected filters. |
| Certificates | The number of certificates earned by the participant based on program completion criteria. |
| Duration | The cumulative time the participant spent attending sessions. |
This table serves as the foundation for participant-level analysis, enabling coordinators to:
- Identify highly engaged participants.
- Detect participants who are registered but not attending.
- Support targeted communication and follow-ups.
- Generate reports for stakeholders and funders.
What to Look For?
- High Sessions Joined: Indicates strong engagement and commitment.
- Zero Sessions Joined: Suggests the need for outreach or onboarding support.
- Certificates Earned: Helps track program completion and recognize participant achievements.
- Geographical and Professional Diversity: Ensures the program is reaching its intended audience.
- Low Attendance Duration: May signal technical issues or partial participation.
Actions to Take
- Reach out to participants with low or zero attendance.
- Recognize and engage highly active participants as champions.
- Validate participant data to ensure accurate reporting.
- Use profession and location insights to refine outreach strategies.
Participant Detail View
Clicking a participant's name or the arrow icon opens a detailed dashboard summarizing their engagement across programs and sessions.
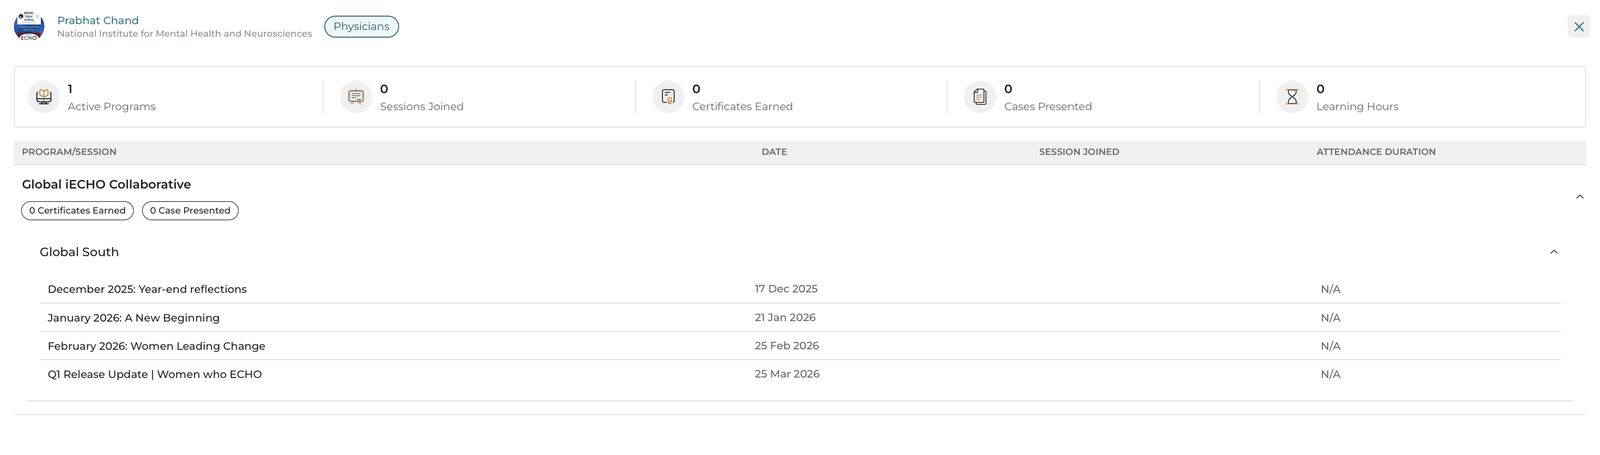
At the top of the detail view, several summary cards provide a quick snapshot of the participant's involvement:
| Metric | Description | Why It Matters |
|---|---|---|
| Active Programs | Number of programs in which the participant is currently enrolled or has participated. | Indicates the breadth of engagement across the iECHO network. |
| Sessions Joined | Total number of sessions attended by the participant. | Reflects consistency and commitment to learning. |
| Certificates Earned | Number of certificates issued to the participant. | Demonstrates successful completion of program requirements. |
| Cases Presented | Number of de-identified cases presented by the participant. | Highlights active contribution to the ECHO model. |
| Learning Hours | Total duration of participation across sessions. | Useful for accreditation and reporting continuing education hours. |
Below the summary metrics, a structured table displays the participant's engagement across specific programs and sessions.
Table Columns
| Column | Description |
|---|---|
| Program/Session | Lists the program name and its associated sessions. Programs can be expanded or collapsed for easier navigation. |
| Date | The scheduled date of each session. |
| Session Joined | Indicates whether the participant attended the session. |
| Attendance Duration | The amount of time the participant spent in the session. "N/A" may appear if attendance data is unavailable. |
| Certificates Earned / Cases Presented | Tags next to the program name summarizing achievements within that program. |
What to Look For?
- Consistent Attendance: Indicates strong participant engagement.
- Missed Sessions: May highlight scheduling conflicts or engagement challenges.
- High Learning Hours: Demonstrates meaningful participation.
- Case Presentations: Reflect deeper involvement in the ECHO model.
- "N/A" in Duration: Could indicate missing or unrecorded attendance data.
Actions to Take
- Follow up with participants who frequently miss sessions.
- Encourage engaged participants to present cases.
- Verify Zoom or attendance integrations if duration data is missing.
- Use the data to support certification and accreditation processes.
Practical Use Cases
| Scenario | How the Dashboard Helps |
|---|---|
| Certification Verification | Identify participants who meet completion criteria. |
| Engagement Monitoring | Track attendance and learning hours to assess commitment. |
| Targeted Outreach | Contact participants with low attendance or engagement. |
| Impact Reporting | Provide evidence of participation for stakeholders and funders. |
| Champion Identification | Recognize highly engaged participants for leadership roles. |